Our approach to stochastic investment modelling
10E24 has developed an asset model to generate stochastic simulations for a wide range of assets classes, market indices and portfolios/products. We have extensive investment expertise having written investment models that are currently used by, or have been used by, large Australian Superannuation funds, financial advice dealer groups, actuarial consulting firms and the Australian Federal Government.
It’s essential that the simulated investment returns from each asset class are appropriately correlated to price inflation, other asset classes, and its own history (auto-correlation). To ensure this occurs, simulated returns from each asset class are derived by considering the underlying risk factors that drive those returns.
Historical data provides us with empirical evidence of the inter-relationship between asset classes as well as their behaviour at times of crises. The 10E24 asset model (RSAM) and the parameters used to generate the simulations, have been heavily influenced by historical data. Relying solely on historical data can be misleading however due to dangers associated with datamining and survivorship biases. Consequently, we tend to combine historical data with accepted economic theory.
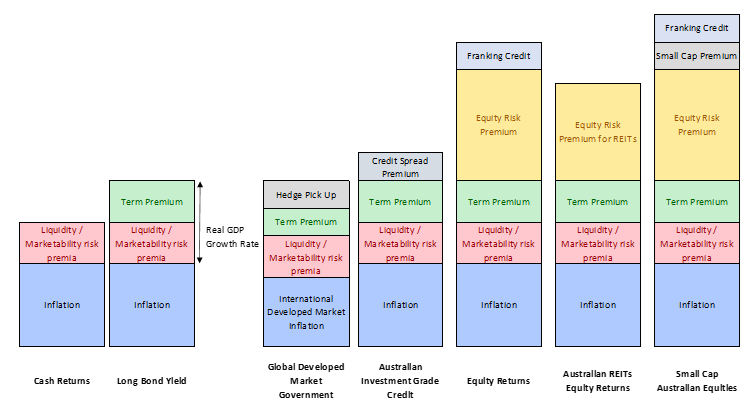
The total return from each asset class can be decomposed into key risk drivers. As an example, the expected return from cash is the sum of expected inflation together with a risk premium to entice investors to defer consumption. This premium is commonly referred to as the liquidity risk premium. In a similar way, equities are a function of inflation plus the same liquidity risk premium, a term premium and an equity risk premium. On top of this Australian equities enjoy taxation benefit from franking credits.
It’s essential that the simulated investment returns from each asset class are appropriately correlated to price inflation, other asset classes, and its own history (auto-correlation). To ensure this occurs, simulated returns from each asset class are derived by considering the underlying risk factors that drive those returns.
Historical data provides us with empirical evidence of the inter-relationship between asset classes as well as their behaviour at times of crises. The 10E24 asset model (RSAM) and the parameters used to generate the simulations, have been heavily influenced by historical data. Relying solely on historical data can be misleading however due to dangers associated with datamining and survivorship biases. Consequently, we tend to combine historical data with accepted economic theory.
The total return from each asset class can be decomposed into key risk drivers. As an example, the expected return from cash is the sum of expected inflation together with a risk premium to entice investors to defer consumption. This premium is commonly referred to as the liquidity risk premium. In a similar way, equities are a function of inflation plus the same liquidity risk premium, a term premium and an equity risk premium. On top of this Australian equities enjoy taxation benefit from franking credits.
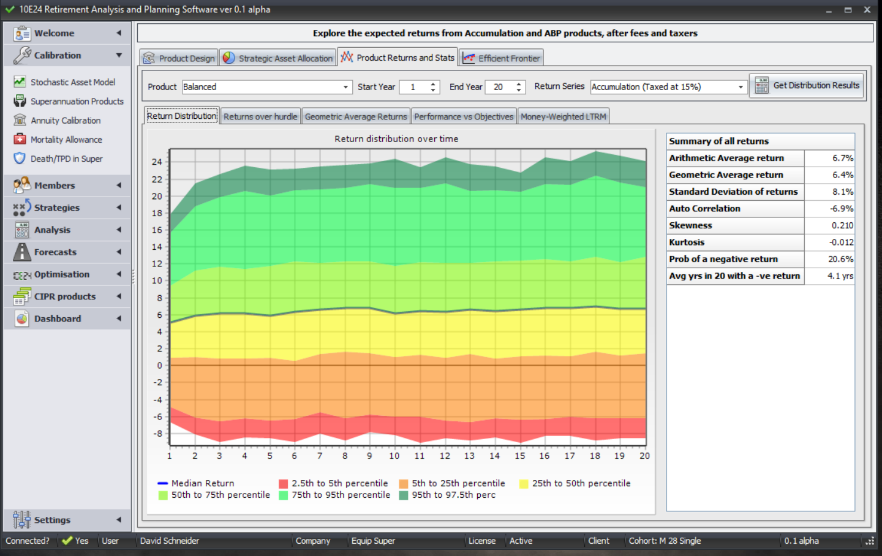
Initial Conditions vs Equilibrium Assumptions
Our stochastic model begins with current market conditions which gradually alter and converge to our long term equilibrium assumptions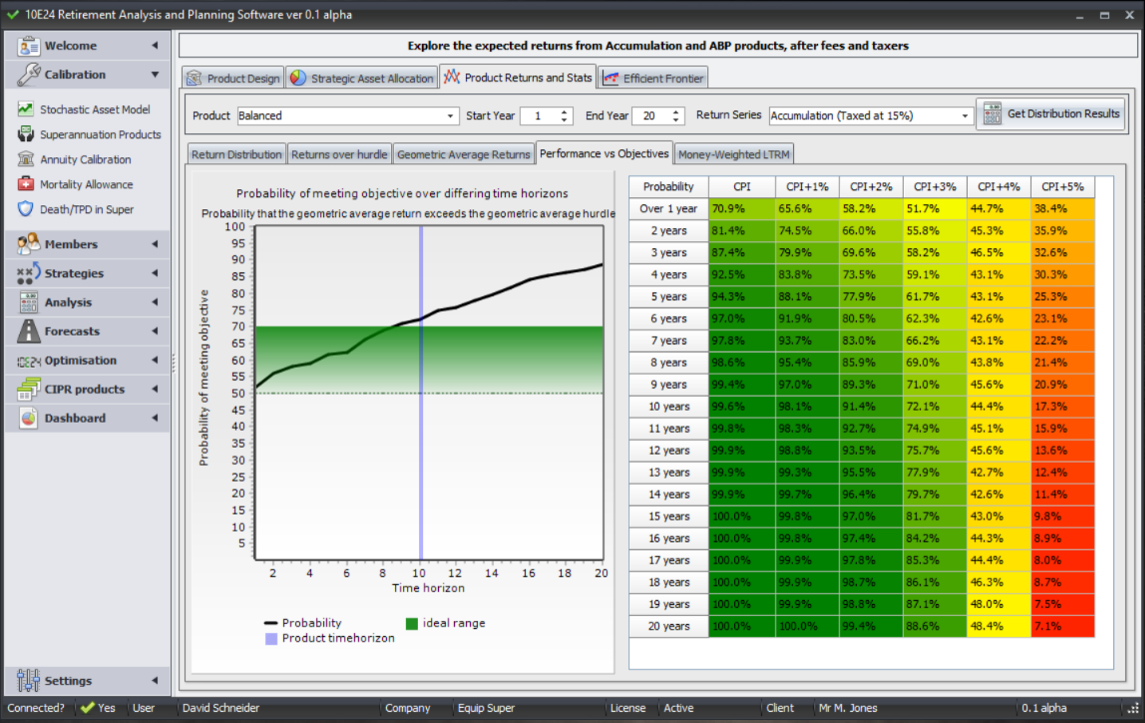
Calibration
It’s important that the asset model is constructed on a basis that is economically consistent and reflects the correlations between asset classes and inflation. One of the key drivers of a client’s future spending needs in retirement is likely to be the rate at which their salary or earnings grow whilst they are working, and price inflation from when they retire. Our asset model generates equity and other asset class returns that are consistent with the simulated inflation rates.We typically generated 2,000 stochastic simulations for each of the major asset classes. We calibrated the simulation model to ensure that markets transition from their current spot values to the long-term equilibrium assumptions.
The simulations are calibrated in a way that ensures the 2,000 sequences of returns from each asset class represents the full range of possible economic scenarios that could influence Australian households.
Regime Switching
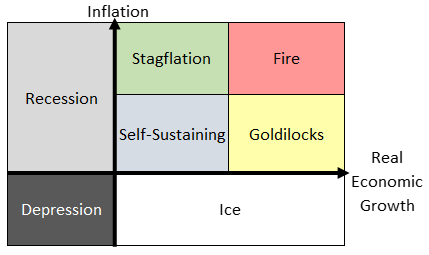
We believe that the businesses, governments and consumers think and behave differently in various economic regimes. Some regimes like recession and stagflation are typically associated with rapid falls in risk assets, whereas others (where inflation is anchored and growth is above trend) are typically associated with rising equity values.The 10E24 Asset Model carefully considers economic regimes and allows for a shift in regimes via a Markov process . The economic regimes are determined with reference to simulated price inflation and real GDP growth rates. The chart below shows the way economic regimes are categorised within our Asset Model